MSDN:
Understanding Plan Guides:
This topic describes plan guides and explains how they can be used to optimize the performance of queries when you cannot or do not want to change the text of the query directly. Plan guides can be useful when a small subset of queries in a database application deployed from a third-party vendor are not performing as expected. Plan guides influence optimization of queries by attaching query hints or a fixed query plan to them. In the plan guide, you specify the Transact-SQL statement that you want optimized and either an OPTION clause that contains the query hints you want to use or a specific query plan you want to use to optimize the query. When the query executes, SQL Server matches the Transact-SQL statement to the plan guide and attaches the OPTION clause to the query at run time or uses the specified query plan.
Java Call: (using a Prepare Execution Model)
cmd = conn.prepareStatement("select GroupID from dbo.ViewNameHere WHERE ID = ?");
cmd.setInt(1, userId);
rs = cmd.executeQuery();
Solution:
EXEC sp_create_plan_guide @name = N'[PlanGuide-1]', @stmt = N'select GroupID from dbo.ViewNameHere WHERE ID = @P0 ',
@params = N'@P0 int', @type = N'SQL', @hints = N'option (recompile)'
Using the newly created MSSQL Plan guides, with the hint OPTION(RECOMPILE) added, the View calls go from 10sec duration to 25ms duration.
Notes:
Tried enabling DBCC TRACEON(4136,-1) - had no affect
Tried modifying Database Properties...Parameterization=Forced - had no affect
Tried updating the stats with fullscan for all tables used in View - UPDATE STATISTICS tbl_name_here WITH FULLSCAN - had no affect
*Re-indexing all tables & updating all stats may of had an affect as Query Plans are based off Statistics. (see Selectivity, Density, Cardinality in "Tips, Tricks, and Advice from the SQL Server Query Optimization Team" below)
Better Solution Option:
Instead of using AdHoc View calls w/ Plan Guides:
#1. Add the OPTION(Recompile) at the end of the Java View calls
#2. Replace the Views with Stored Procedures
- Stored Procedures allow OPTION clause but Views do not.
- Stored Procedures allow code control vs Java Calls can send any SQL Statements joining numerous Views
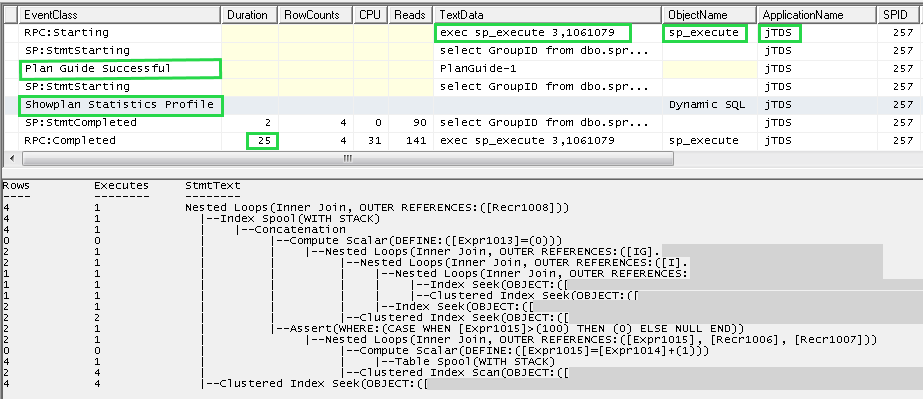
Image 1: MSSQL SQL Profiler
Resources:
Preparing SQL Statements
Understanding Plan Guides
sp_create_plan_guide
sp_prepare
sp_execute
Tips, Tricks, and Advice from the SQL Server Query Optimization Team
DBCC SHOW_STATISTICS
DBCC SHOW_STATISTICS displays current query optimization statistics for a table or indexed view. The query optimizer uses statistics to estimate the cardinality or number of rows in the query result, which enables the query optimizer to create a high quality query plan. For example, the query optimizer could use cardinality estimates to choose the index seek operator instead of the index scan operator in the query plan, improving query performance by avoiding a resource-intensive index scan.
The query optimizer stores statistics for a table or indexed view in a statistics object. For a table, the statistics object is created on either an index or a list of table columns. The statistics object includes a header with metadata about the statistics, a histogram with the distribution of values in the first key column of the statistics object, and a density vector to measure cross-column correlation. The Database Engine can compute cardinality estimates with any of the data in the statistics object.
DBCC SHOW_STATISTICS displays the header, histogram, and density vector based on data stored in the statistics object. The syntax lets you specify a table or indexed view along with a target index name, statistics name, or column name. This topic describes how to display the statistics and how to understand the displayed results.
*See SQL Server Management Studio..Databases..Table.."Statistics"
DBCC SHOWCONTIG
Displays fragmentation information for the data and indexes of the specified table or view.
DBCC SHOWCONTIG determines whether the table is heavily fragmented. Table fragmentation occurs through the process of data modifications (INSERT, UPDATE, and DELETE statements) made against the table. Because these modifications are not ordinarily distributed equally among the rows of the table, the fullness of each page can vary over time. For queries that scan part or all of a table, such table fragmentation can cause additional page reads.
sys.dm_db_index_physical_stats
The sys.dm_db_index_physical_stats dynamic management function replaces the DBCC SHOWCONTIG statement.
Ex:
DBCC SHOW_STATISTICS ('dbo.TableNameHare','IndexNameHere')
--Check Updated field
--Compare rows to actual # of rows(run a select count(*) from tbl) to see if Statistics are out-dated
--Density
DBCC SHOWCONTIG ('dbo.TableNameHere', 1)
or
SELECT * FROM sys.dm_db_index_physical_stats (DB_ID(N'DBNameHere'), OBJECT_ID(N'dbo.TableNameHere'), NULL, NULL , 'DETAILED');
|
|
|
|
|
|